Latest quarterly statistics
Our quarterly Aviation Trends report.
The images below are taken from the CAA’s quarterly Aviation Trends report. They show annual records of UK flight movements, passengers, punctuality and more, over the past 10 years. Further information and detail are held in the report.
For the full quarterly Aviation Trends report see: Aviation trends 2026 Q1
For access to the underlying data in the report see:
10 year trends
Annual Passengers, Air Transport Movements (ATM) and Cargo Tonnage
ATMs (millions)
(NB: 2025 values are year-to-date and will update throughout the year)
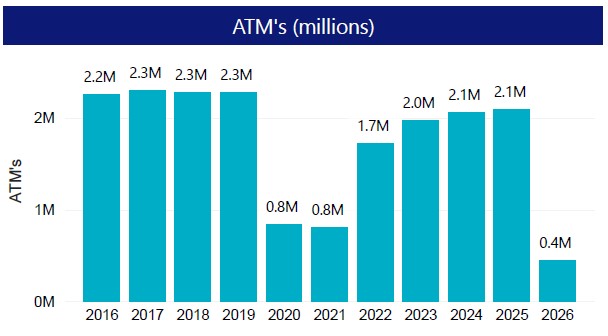
| Year | ATM (millions) |
| 2016 | 2.2 |
| 2017 | 2.3 |
| 2018 | 2.3 |
| 2019 | 2.3 |
| 2020 | 0.9 |
| 2021 | 0.8 |
| 2022 | 1.7 |
| 2023 | 2 |
| 2024 | 2.1 |
| 2025 | 2.1 |
| 2026 | 0.4 |
Terminal passengers (millions)
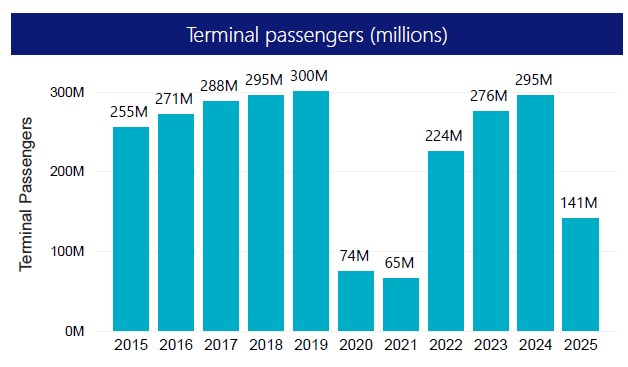
| Year | Terminal passengers (millions) |
| 2016 | 271 |
| 2017 | 288 |
| 2018 | 295 |
| 2019 | 300 |
| 2020 | 74 |
| 2021 | 65 |
| 2022 | 224 |
| 2023 | 276 |
| 2024 | 295 |
| 2025 | 302 |
| 2016 | 61 |
Cargo tonnage (millions)
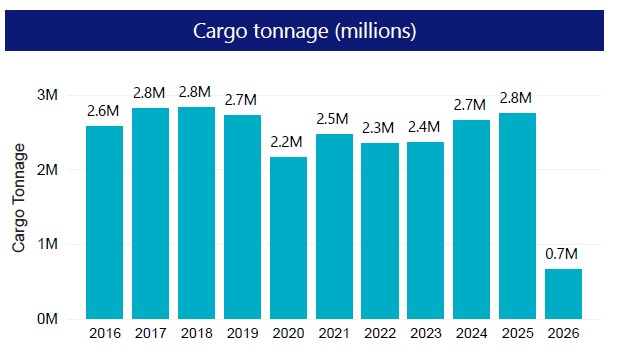
| Year | Cargo tonnage (millions) |
| 2016 | 2.6 |
| 2017 | 2.8 |
| 2018 | 2.8 |
| 2019 | 2.7 |
| 2020 | 2.2 |
| 2021 | 2.5 |
| 2022 | 2.3 |
| 2023 | 2.4 |
| 2024 | 2.7 |
| 2025 | 2.8 |
| 2026 | 0.7 |
Average load factor (%)
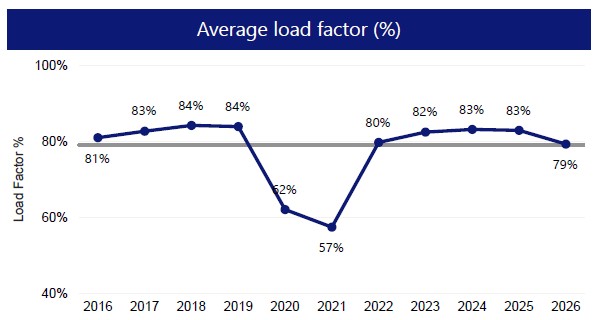
| Year | Average load factor (%) |
| 2016 | 81 |
| 2017 | 82 |
| 2018 | 84 |
| 2019 | 84 |
| 2020 | 61 |
| 2021 | 57 |
| 2022 | 79 |
| 2023 | 82 |
| 2024 | 83 |
| 2025 | 83 |
| 2026 | 79 |
Average seats per flight
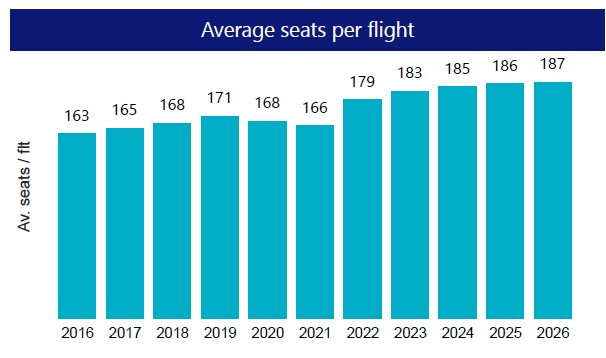
| Year | Average seat per flight |
| 2016 | 162 |
| 2017 | 165 |
| 2018 | 166 |
| 2019 | 170 |
| 2020 | 164 |
| 2021 | 165 |
| 2022 | 177 |
| 2023 | 181 |
| 2024 | 183 |
| 2025 | 185 |
| 2026 | 187 |
Flight punctuality trends
Percentage on time performance (percentage of flights operated within 15mins of scheduled time)
(NB: 2025 values are year-to-date and will update throughout the year)
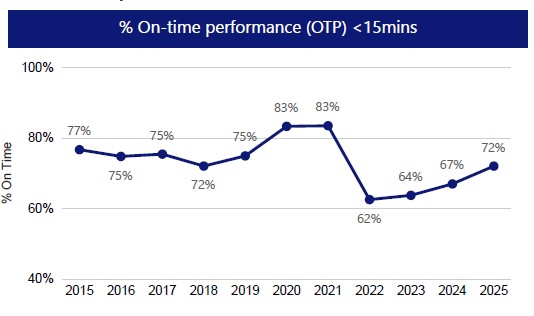
| Year | Flights operated within 15mins of scheduled time (%) |
| 2016 | 75 |
| 2017 | 75 |
| 2018 | 72 |
| 2019 | 75 |
| 2020 | 83 |
| 2021 | 83 |
| 2022 | 62 |
| 2023 | 64 |
| 2024 | 67 |
| 2025 | 73 |
| 2026 | 77 |
Average delay minutes per flight
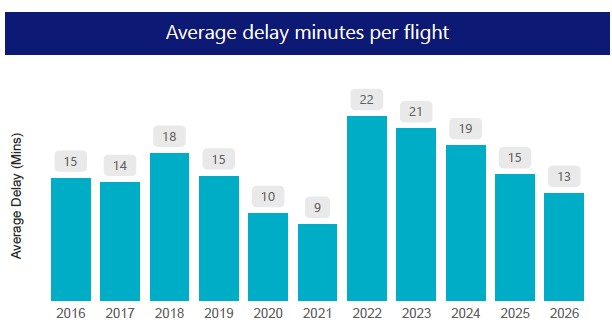
| Year | Average delay minutes per flight |
| 2016 | 15 |
| 2017 | 14 |
| 2018 | 18 |
| 2019 | 15 |
| 2020 | 10 |
| 2021 | 9 |
| 2022 | 22 |
| 2023 | 21 |
| 2024 | 19 |
| 2025 | 15 |
| 2026 | 13 |
Percentage of flights cancelled (within 24 hours before departure)
(NB: Comprehensive cancellation data is reported from 2018.)
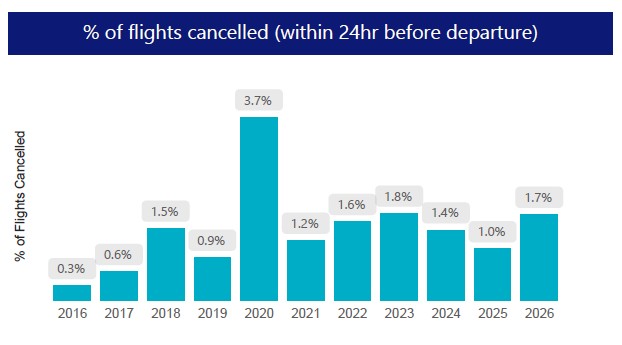
| Year | Flight cancelled within 24 hours of scheduled departure (%) |
| 2016 | 0.3 |
| 2017 | 0.6 |
| 2018 | 1.5 |
| 2019 | 0.9 |
| 2020 | 3.7 |
| 2021 | 1.2 |
| 2022 | 1.6 |
| 2023 | 1.8 |
| 2024 | 1.4 |
| 2025 | 1.0 |
| 2026 | 1.7 |
Provide feedback for this page